IT architects try to use views and viewpoints to convey the target architecture to the various stakeholders. Each stakeholder has their own interests in the architecture and wants to see their requirements fulfilled. A core role of the architect is to understand these requirements and make sure the requirements are met, and to balance all the different requirements.
Architecture languages or meta-models often put significant focus on these views. Archimate has a large annex on Example Viewpoints just for this purpose. However, unless the organization is widely accustomed to enterprise architecture views, it is unlikely that the views themselves are the final product: being able to translate those views into pretty slides and presentations is still an important task for architects when they need to present their findings to non-architecture roles.
Infrastructure domain in viewpoints
While searching for a way to describe the infrastructure domain, I tend to align with certain viewpoints as well, as it allows architects to decompose a complex situation into more manageable parts. So the question is no longer "how do I show what the infrastructure domain is", but rather "what different viewpoints do I need to cover the scope of (and explanation on) the infrastructure domain".
I currently settle on five views:
- A component view, which covers the vertical stack of an IT infrastructure component.
- A location view, which is the horizontal stack for IT infrastructure
- A process view, which covers the general enterprise requirements for IT infrastructure
- A service view, which provides insights into what functional offerings are provided (and for which I posted a current view a short while ago, titled "An IT services overview")
- A zoning view, which represents the IT environment landscape. A few years ago, I covered this as well in "Structuring infrastructural deployments"
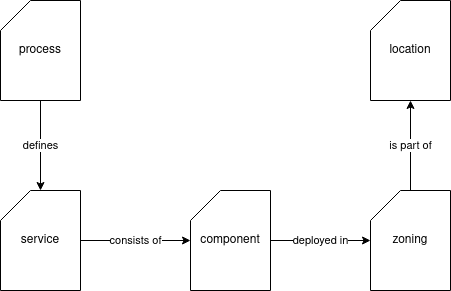
All these views are related to each other, but represent insights that are particularly useful for certain discussions or representations. Some viewpoints are even details for another. For instance, the zoning view is a view that provides more detail on a particular layer in the location view. A simple relationship between the above five views is the following:

Now, this isn't a proper meta-model, just a representation. It starts with what the infrastructure domain has to accomplish (process view), which defines the services the domain has to support. These services comprise several components, and these are deployed in various zones across the organization. The zone overview is part of the more elaborate location views.
Components are a good introduction to infrastructure
While a good coverage of the infrastructure domain would start with the process view, I think it is not always the easiest. Not all stakeholders are fully acquainted with processes and what they entail, and I feel it might be easier to start with a more tangible view, i.e. a component view.
For instance, when explaining what IT infrastructure is to an outsider (say, a family member that isn't active in the IT world), I often start with a component view (often using a cellphone as a starting example), then going about the massive amount of components that need to be managed, hence the need for proper processes. After elaborating a bit on the various processes involved, we can then go to a service overview, to then move on to the hosting of all those services in a structured and reliable environment (zoning), with the various challenges related to locations.
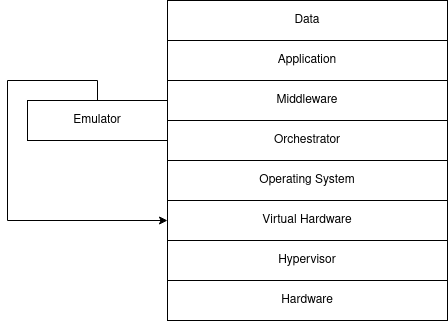
So, what is the component view that I reuse a lot? It is basically the vertical stack that most hosting-related services use to explain where their product is situated:

If you start with a cellphone view, then you can easily describe the hardware, operating system, application, and data layers in the view. You can mention that the hardware is an expensive one-time investment that the user hopes to use for a few years (so you can explain capital expenditures (CapEx) and operational expenditures (OpEx). The latter can be a cloud service that the user synchronizes its data to, like Apple iCloud or Google Drive).
The distinction between operating system and application, and its impact on the users, can also be explained easily: operating system upgrades are heavier, and users often want to choose when this occurs, as operating system upgrades are not always fully backward compatible. Or, the user's hardware isn't supported on the next operating system (e.g. upgrading Apple iOS 12 to iOS 13, or Android 10 to Android 11). Applications, on the other hand, are often automatically updated and are less intrusive. However, because there are many applications, managing the application landscape can be more daunting than the operating system one.
Then we can move on to the scaling challenges that an organization has to face, which will gradually build up more insights into the component layers. For instance, if a company is developing and maintaining a mobile application, it wants to test its new releases on different operating system versions. But it would not be sensible to have each developer walk around with six phones because they need to test the application on iOS 12, iOS 13, iOS 14, Android 9, Android 10, and Android 11. Instead, testing could be done on emulators (which can be considered hypervisors, albeit often not that exhaustive in features).
This introduces concepts of optimizing resources for cost, but also the benefits of having these services available 'at distance' (remote access to the emulation environments) as well as first steps in virtualization. You can state that this emulation is something the user can do on their laptops, but that in enterprise environments this is done with either cloud services or on the enterprise servers, as that facilitates collaboration with team members, and simplifies managing these assets when the teams get larger or smaller. And these servers, well, they too are virtualized for resource optimization.
We can also discuss the data layer, and the challenge that a regular user has when their phone is near its limits (e.g. storage is full), the options the user has (add SD card if the phone supports it, or use cloud storage services), and compare that with larger enterprises where data hosting is often either centralized or abstracted, so that systems are not bound to the limits of their device's storage capacity.
Component views enable scalability and cost insights
The layered view on components, of course, is a meta-view rather than an actual one: it shows how a stack can be built up, but the actual benefit is when you look at the component view of a solution.
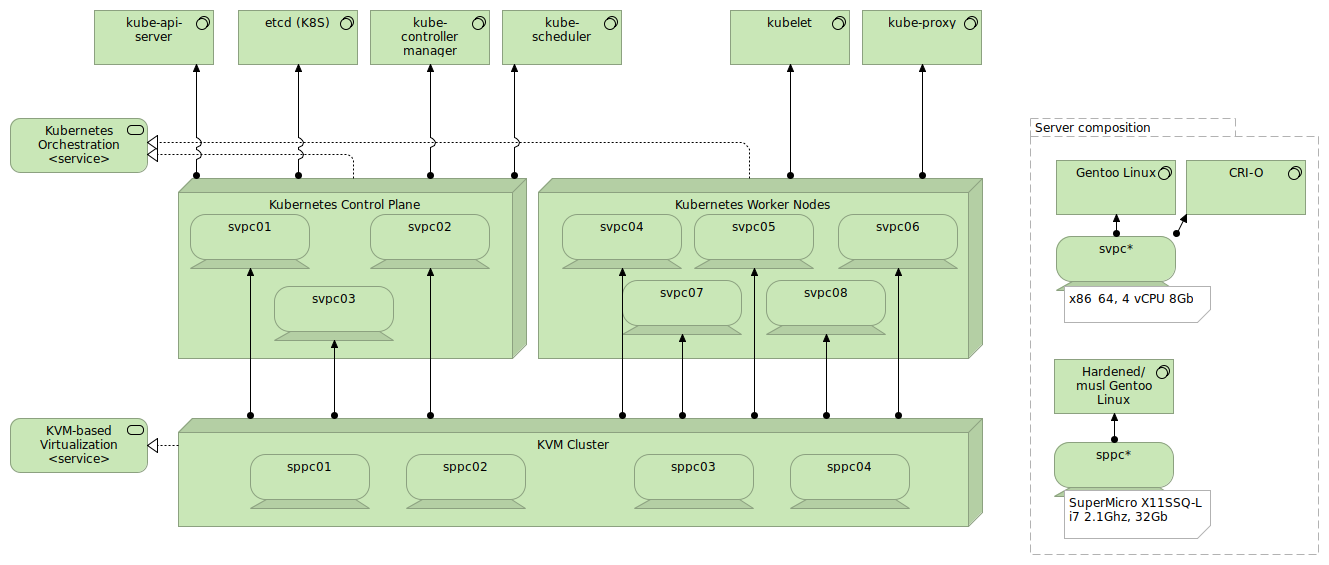
For instance, if we were to assess a Kubernetes cluster, it could be represented as follows:

Going bottom-up on this view, we can identify (and thus elaborate on) the various layers:
- On the hardware level, we see four physical servers (named sppc01 to sppc04). These servers are of a particular brand and have 32 Gb of memory each (which isn't a lot, the cluster is rather small).
- KVM is used as the hypervisor. The hypervisor combines the four physical servers in a single cluster.
- KVM then provides eight virtual systems (named svpc01 to svpc08) from the cluster. The first three are used for the Kubernetes control plane, the others are the worker nodes. Note that it is recommended to host the nodes of the control plane on different physical machines so that a failure on one physical machine doesn't jeopardize the cluster availability. This can be configured on the hypervisor, but that is outside the scope of this article.
- The physical servers use a hardened Gentoo Linux operating system using the musl C library, whereas the virtual servers use a regular Gentoo Linux installation as their operating system.
- The orchestration layer is Kubernetes itself, using the CRI-O container runtime as middleware.
- The applications depicted are those of the Kubernetes ecosystem, with the main control plane applications and worker node applications listed.
If we were to host an application inside the Kubernetes cluster, it would be deployed on the worker nodes. The logical design of a Kubernetes cluster is not something to be represented in a component view (that's more for the location view, as there we will talk about the topology of services).
With such component views, we can have some insights into the costs. Of course, this is just a simple Kubernetes cluster, and built with pure open-source software, so the costs are going to be on the hardware side (and the resources they consume). In larger enterprises, however, the hypervisor is often a commercially backed one like Hyper-V (Microsoft) and vSphere (VMware), which have their specific licensing terms (which could be the number of machines or even CPUs). Also, enterprises often use a commercially backed Kubernetes, like Rancher or OpenShift (Red Hat, part of IBM), which often have per-node licensing terms.
Component views are just the beginning
When I use a component view to explain what infrastructure is about, it is merely the beginning. It provides a rudimentary layered view, which most people can easily relate to. Content-wise, it is reasonably understandable (or easy enough to explain) for people that aren't IT savvy, and is something that you can easily find a lot of material for online.
If we delve into the processes of (or related to) infrastructure, it becomes more challenging to keep the readers/listeners with you. Processes can (will) often be very abstract, and going into the details of each process is a lengthy endeavor. I'll cover that in a later post.
Feedback? Comments?
A few days ago I've dropped Disqus as comment engine from my blog site, mainly for concerns about my visitor's security, as well as the advertisements that it embedded. I want my blog to be simple and straightforward, so I decided to not have any other third-party services with it for now.
So, if you have feedback or comments, don't hesitate to drop me an email, or join the discussion on Twitter